This tutorial covers Grafana 2.6.0, InfluxDB 0.9.6.1 and Riemann 0.2.10, but it should be fine for all future micro versions.
If you are like me, living under the rock last couple of years, you probably have no clue what this how-to is about. In short, it is about setting up a modern monitoring system, capable of high throughput, flexible routing, and good scalability.
Modern systems these days are pushing a lot of small services (or microservices), often scattered over many servers (dedicated or VPS), service providers (AWS, Google CP, IBM Bluemix, you name it) or your applications; decoupled architecture, as experts would call it.
The problem with this approach is catching all the pieces when the system grows, getting the bigger picture of how it behaves and the most important, reacting on time when something bad happens. When you have a lot of moving parts, THE most important thing is a good monitoring system. You already knew this, right ;)
My tool of choice for this kind of tasks usually was Zabbix. I'm not going to write here why is good or bad or compare it to the competition; just I'll say I tried many alternatives in the past and Zabbix was the only one that worked out of the box on different platforms, with all the nice goodies I needed to get the work done. Since it is targeting enterprise, it comes with seamless upgrades, excellent support, and really good scalability.
But, Zabbix is not for everyone. UI is arcane by hipster standards (to be honest, Zabbix UI is a beauty comparing to still widely used Nagios and I do find it more practical than some modern alternatives) and starting without a decent book it will not be that pleasant - Zabbix is complex beast and it takes some time you get what are events, how they are related to triggers and how all of that fits inside templates.
Besides all the things Zabbix can do (trust me, it can do a lot of them), there are a couple of rough places. For example, monitoring multiple Java applications via JMX on a single host isn't the most intuitive thing, singlestat panels are extremely hard to setup (you'll need to hack UI, which is done in PHP) and since Zabbix server does so many things, you can easily hammer it with events (however, this is usually circumvented with proxies, which you can infinitely scale).
So, on my last project, I decided to try something new, something that is currently in and something where other team members would not curse me when I go on vacation ;)
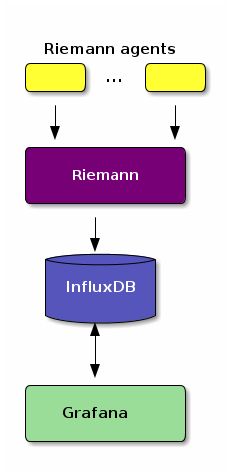
After a bit of toying, I settled up with Grafana, InfluxDB, and Riemann. To have an idea what I'm talking about, here are short descriptions:
Grafana - time series metrics visualization tool. In short, something that displays pretty graphs from raw numbers.
InfluxDB - a platform for storing time series data. Or easily, SQL-ish database optimized for metrics storage.
Riemann - event collector and processor. Something that will receive events, do processing on them (if necessary) and store that in InfluxDB.
Here is a picture how this stack works:
Why Grafana, why InfluxDB and why Riemann you might ask? First of all, because I wanted scalable monitoring system with flexible event processing. And you won't get more flexible processing than Riemann (you have the whole Clojure and Java stack at disposal) plus you can go to the lowest levels possible and modify, collect and route particular messages as you would like.
Besides, this stack is really easy to setup, comparing to other sound alternatives like Graphite, although you can use Graphite instead of InfluxDB for metrics storage or for plotting graphs instead of Grafana, but I wouldn't advise it.
Ingredients
For my setup I used:
In case you are using other distro or OS, both Grafana and InfluxDB projects are providing binaries for major platforms (they are written in Go) and Riemann will work wherever Java is present.
Installing and configuring Grafana
On Ubuntu, install it with:
$ sudo apt-get install grafana -y
Configuring Grafana is straightforward: edit /etc/grafana/grafana.ini to match your desired setup. In my case, I put Grafana behind nginx (of course) and allowed other team members to login with their GitHub accounts. Configuration file looks like this:
app_mode = production

[paths]
data = /var/lib/grafana
logs = /var/log/grafana

[server]
protocol = http
http_addr = 127.0.0.1
http_port = 3000

domain = your-domain.com

# make sure this matches server name and url, otherwise, github login will not work
root_url = https://your-domain.com

[database]
type = sqlite3
path = grafana.db

[session]
provider = file

# ignore this if you are not going to use GitHub for authentication
[auth.github]
enabled = true
allow_sign_up = true
client_id = CLIENT_ID
client_secret = CLIENT_SECRET
scopes = user:email,read:org
auth_url = https://github.com/login/oauth/authorize
token_url = https://github.com/login/oauth/access_token
api_url = https://api.github.com/user
team_ids = YOUT_TEAM_IDS
allowed_organizations = YOUR_ORGANIZATION
This is pretty much it. I took SQLlite for a database (where Grafana will store user credentials, preferences, and dashboard layouts) simply because my Grafana installation does not cope with a large number of users. To be honest, I think SQLlite will be suitable for most Grafana use cases in general.
Installing and configuring InfluxDB
Installation is with:
$ wget https://s3.amazonaws.com/influxdb/influxdb_0.9.6.1_amd64.db
$ sudo dpkg -i influxdb_0.9.6.1_amd64.deb
This is even easier: the main configuration file is /etc/influxdb/influxdb.conf and it works out of the box. I didn't care much about admin panel access (on port 8083) nor securing http access for collecting the data (port 8086) simply because these ports are only availble to the internal network.
However, make sure to investigate configuration file if you are hunting for more secure setup.
The only custom thing here is to create a database where Riemann can write data and you can do it with influx command from the terminal:
$ sudo influx
> CREATE DATABASE riemann
To be assured you have it created correctly, list all available databases inside InfluxDB shell:
> SHOW DATABASES

name: databases
---------------
name
_internal
riemann    <--- riemann database
If you would like to add some security and restrict access to riemann database, create a dedicated user with:
> CREATE USER riemann WITH PASSWORD 'riemann_password'
> GRANT ALL ON riemann TO riemann
Installing and configuring Riemann
Installation is simiar to previous applications:
$ wget https://aphyr.com/riemann/riemann_0.2.10_all.deb
$ sudo dpkg -i riemann_0.2.10_all.deb
Riemann configuration happened to be the harders part so far, mainly because Riemann documentation is odd a little bit, especially for non-clojure devs and admins. There is a sample of riemann.config file on how to connect it with InfluxDB, but it didn't work for me; I presume it is because assumed older InfluxDB version, probably 0.8.
This is working configuration and paste it in /etc/riemann/riemann.config:
;; InfluxDB database details where Riemann will store the data. Setup :username and :password
;; if you added security step behind riemann database access.
(def influxdb-creds {
     :version :0.9
     :host "localhost"
     :port 8086
     :db "riemann"
     ; :username "riemann"
     ; :password "riemann_password"
})

(def influxBatchSender
  (batch 100 1/10
         (async-queue! :agg {:queue-size 1000
                             :core-pool-size 1
                             :max-pool-size 4
                             :keep-alive-time 60000}
                       (influxdb influxdb-creds))))

;; Riemann log file location
(logging/init {:file "/var/log/riemann/riemann.log"})

;; listen on the local interface over TCP (5555), UDP (5555) and websockets (5556)
(let [host "0.0.0.0"]
  (tcp-server {:host host})
  (udp-server {:host host})
  (ws-server  {:host host}))

;; Expire states from its core's index every 60 seconds. Default is 10.
(periodically-expire 60)

(let [index (index)]
  (streams
   (default :ttl 60
     index
     #(info %)
     influxBatchSender)))
And that is pretty much it. Start all services with:
sudo service grafana-server start
sudo service influxdb start
sudo service riemann start
and head up to Riemann tools to find a suitable script for collecting data. Also, check Riemann clients if you are adventurous and would like to embed custom collection scheme inside your application.
I will leave nginx setup as exercise because there are so many tutorials online for it; eg. you can use this one.